Viewing Results in GoldSim
Lesson 3, page 11 of 12
Now you can explore the results of the model.
There are two ways to view results in GoldSim:
- You can view
the results of any element by right-clicking on the specific element you wish to
view, and selecting a result type.For example, if you right-click on the
Pond, the following context menu is displayed:
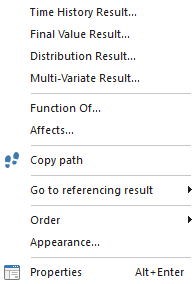
You could then select Time History Result A chart or table showing how a model variable changes with time. to view a time history result, Distribution Result A chart showing the uncertainty in the output of a probabilistic simulation. Distribution results can take the form of a Cumulative Distribution Function, a Complementary Cumulative Distribution Function, or a Probability Density Function. to view a distribution result, Final Value Result... to view a column, bar or pie chart or Multi-variate Result... to view a scatter plot or other multi-variate display.
Note:Although we don't need to be concerned with this detail here, many GoldSim elements The basic building blocks with which a GoldSim model is constructed. Each element represents a feature, pararamer, process or event in the model. have more than one output.In this case, right-clicking on the element and selecting a result option displays the result of the primary output For an element with multiple outputs, the output that has the same name as the element (and is the output that is typically of greatest interest for the element). (the one you are most likely to be interested in). If you want to view other outputs of the element, you can do so by left-clicking on the output port (the green box on the lower right side of the element), which will display a small browser A view of a GoldSim model in which elements are displayed in a tree, and organized either hierarchically, or by type. showing all of the element's outputs.Right-clicking on any of the outputs displays a context menu for selecting a result to view.
- Results can also be viewed using Result elements.Result elements are special elements that you can insert into a model that allow you to easily view and format results.
There are two Result elements in the example model: "Pond Volume", and "Distribution of Minimum Volume". We will use these Result elements to view the results.
View a Time History Result:
- Double-click on "Pond
Volume". This is a Time History plot, showing the time history of pond volume:
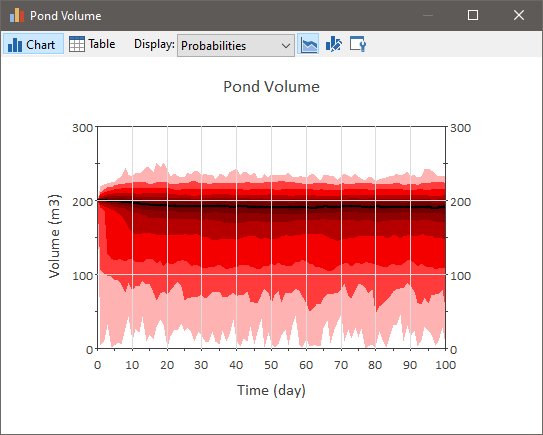
You'll notice that the graph doesn't display a single line. By default, GoldSim combines all of the realizations of the model statistically, and displays the percentiles of the time history data (you can view the percentiles by holding your cursor over the plot, or right-clicking in the chart and turning on a legend). GoldSim allows you to customize the statistics that are displayed, and the colors used to display them.This is referred to as a probability history A probabilistic representation of the time history of an output in which the percentiles for multiple realizations are displayed..
Let's now view a single realization A single model run within a Monte Carlo simulation. It represents one possible path the system could follow through time. of the model. - From the Display
drop-list, select "Realization". A single realization of the model will be
displayed (realization #1 is displayed below):
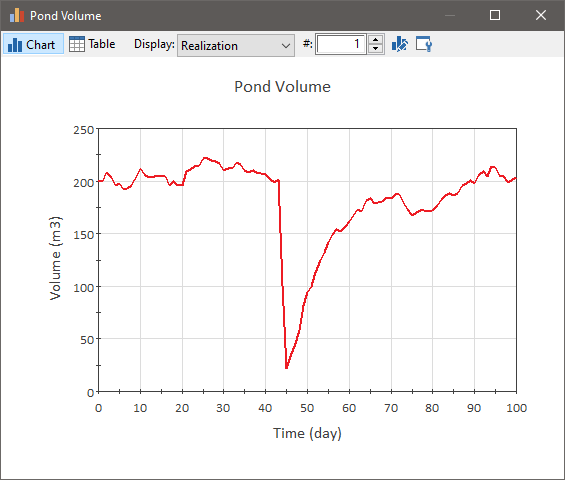
The realization field allows you to jump to a specific realization by entering a realization number, or you can use the control to the right of the realization field to scroll through the realizations.
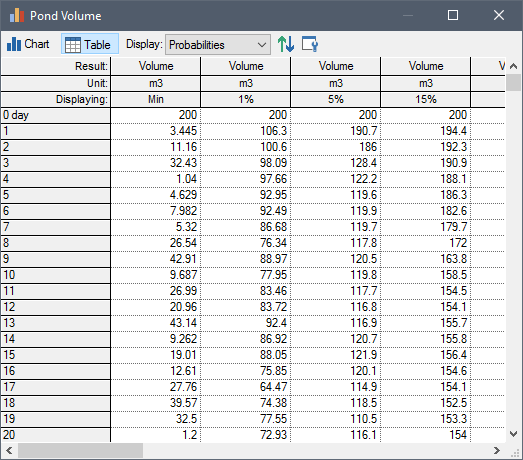
Now switch back to viewing the statistical results by selecting "Probabilities" from the Display drop-list. - You can also view results
(either the combined results or a single realization) in table form.Click
the Table button. This will display the result in table form:
- Return to chart view by clicking the Chart button.
- Close the window by clicking on the X in the upper right hand corner of the window.
Let's now look at a distribution result.
View a Distribution Result:
- Double-click on the
"Distribution of Minimum Volume" Result element An element that can be used to organize, analyze and display results.:
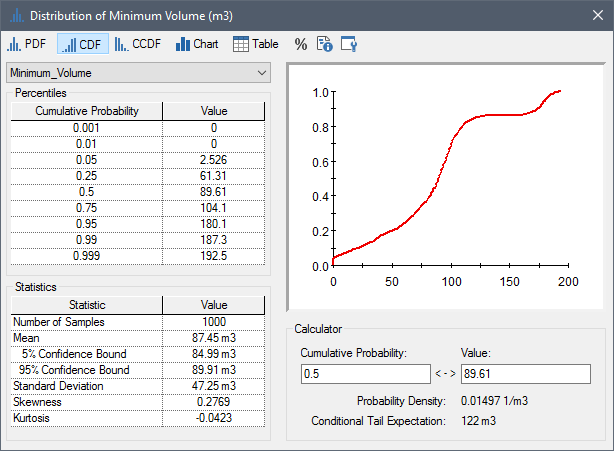
This graph shows the distribution of the minimum volume of water in the pond during a simulation. Results are displayed in table, graph, and statistical formats. In the next Lesson we will discuss how this was actually calculated, but for now let's briefly explore the results in order to better understand them.
Recall that our goal was to determine the likelihood that the pond will be emptied (and hence be unable to deliver the full 100 m3 of water when required for fire suppression) over the time frame of the simulation (i.e., the next 100 days).
The left-hand side of the dialog shows the percentiles of the result, and these are plotted as a Cumulative Distribution Function (CDF) on the right side of the dialog. This indicates, for example, that the there is a 50% chance that the minimum volume will be less than 89.61 m3 (and a 50% chance that it will be greater than this). Similarly, there is a 5% chance that the minimum volume will be less than about 2.5 m3.
What we want to know, however, is the probability of the minimum value being zero (as this would imply that a withdrawal completely emptied the pond).
We can do this by looking at the Calculator section of the dialog. - In the Calculator section
of the dialog, enter a Value of 0:
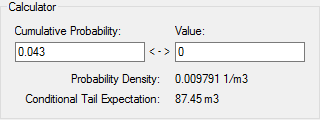
When you do so, GoldSim displays the Cumulative Probability of that result. That is, it indicates the probability of the volume being at (or less than, which in this case, is impossible) that value.Hence, there's our answer: the probability that the pond will actually be emptied (and hence be unable to deliver the full 100 m3 of water when required for fire suppression) over the time frame of the simulation is 4.3%. - Close the window either by clicking on the X in the upper right hand corner of the window.
When a model is in Result Mode The state of a GoldSim model when it has been run and contains simulation results., we cannot make changes to the model. To change a model in a way that may affect results, you must be in Edit Mode The state of a GoldSim model when it is being edited and does not contain simulation results.. Returning to Edit Mode deletes all results (so that the results always reflect the current state of the model). Let's return to Edit Mode now.
Return to Edit Mode
- On the GoldSim toolbar,
click the Edit Mode button.

- The following dialog will
be displayed:
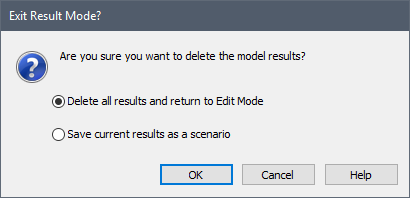
- Press OK to delete the results and return to Edit Mode.
Note: You can also return to edit mode by selecting Run | Return to Edit Mode from the main menu, or by pressing F4.)