Representing Complex Relationships Using Lookup Tables
Lesson 5, page 5 of 15
In some situations, you may wish to define a complex relationship between variables which cannot be readily written as an equation. You might, however, have some data which describes the relationship in terms of a series of (X,Y) pairs.
If you had a sufficient number of data pairs, this would provide a fairly accurate description of the functional relationship. Then, for any given value of X, you could use the table to "look up" the corresponding value for Y (by either using the closest data point, or perhaps interpolating between data points). Such a table is referred to as a lookup table, or more generally (if there is more than one independent variable), a response surface. Response surfaces provide a powerful and flexible way to represent complex relationships between variables that cannot readily be expressed using equations.
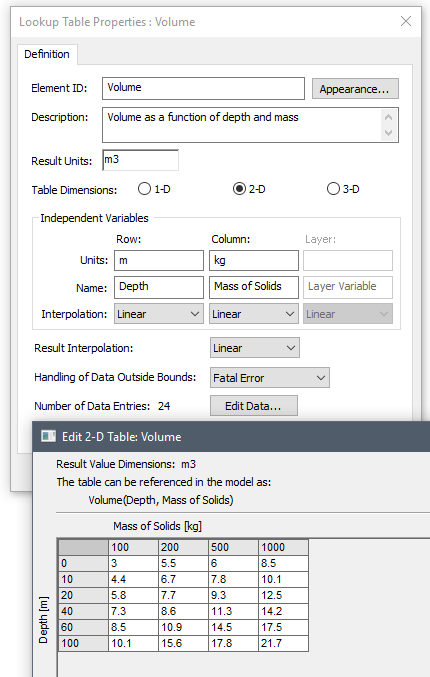
GoldSim provides a powerful Lookup Table A function element that allows you to create a 1, 2, or 3-dimensional lookup table (response surface). element to support this.Lookup Tables can be defined in terms of one, two or three independent variables:
Note: One possible way to more realistically have represented the fire occurrence in the Tutorial example would have been to model weather parameters such as temperature and rainfall (e.g., using Time Series An Input element that allows you to specify a time series of values. elements The basic building blocks with which a GoldSim model is constructed. Each element represents a feature, pararamer, process or event in the model.), and then use a Lookup Table element that related the rate of occurrence to the temperature and cumulative rainfall.