Determining the Probability of Running Out of Water
Lesson 4, page 13 of 14
Now that we have set up an Extrema element A Function element that records the highest (or lowest) value of a variable observed during a simulation. to track the minimum volume observed for each realization A single model run within a Monte Carlo simulation. It represents one possible path the system could follow through time., the final step is to add a Distribution Result A chart showing the uncertainty in the output of a probabilistic simulation. Distribution results can take the form of a Cumulative Distribution Function, a Complementary Cumulative Distribution Function, or a Probability Density Function. element so we can look at the statistics for the Extrema after we run multiple realizations.
Add a Distribution Result Element:
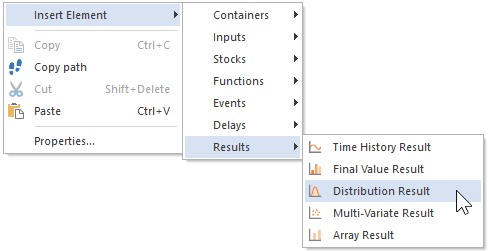
- In the graphics pane The primary portion of the GoldSim interface, where the graphical depiction of the model is shown., right-click to open a context menu.
- Select Insert
Element, Results, Distribution Result:
Once you've inserted the element, its Properties dialog will immediately open: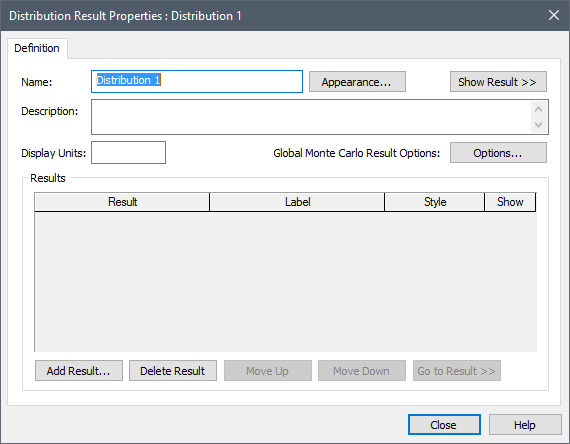
- In the Name field, type "Distribution of Minimum Volume" (unlike other elements The basic building blocks with which a GoldSim model is constructed. Each element represents a feature, pararamer, process or event in the model. in GoldSim, Result element An element that can be used to organize, analyze and display results. names can have spaces).
- In Description, type "Distribution of the lowest volume observed in pond".
- Press the Add Result... button.
- From the list displayed,
select Minimum_Volume and press OK.
The completed dialog should look like this: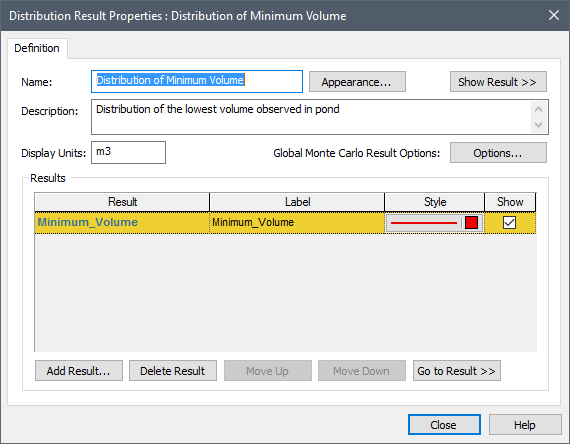
- Press Close to close the dialog.
Now let's run the model again.
Run the Model:
- Click Run on the toolbar:

- When the model finishes running, a "Simulation Complete!" message is displayed. Press OK to continue. The model is now in Result Mode The state of a GoldSim model when it has been run and contains simulation results..
- Double-click on the "Distribution of Minimum Volume" element to view the
result:
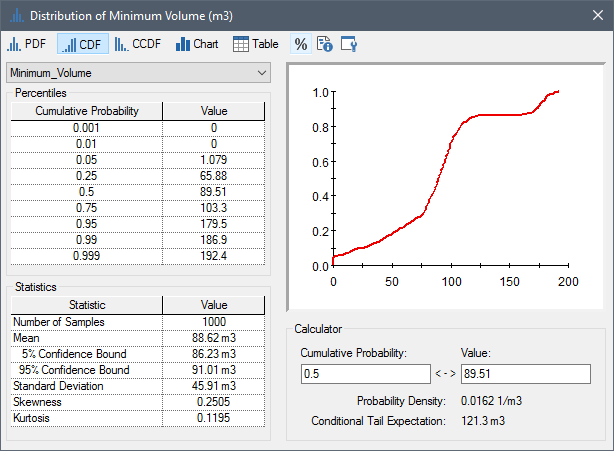
This graph shows the distribution of the minimum volume of water in the pond during a simulation. Results are displayed in table, graph, and statistical formats.Recall that our goal was to determine the likelihood that the pond will actually be emptied (and hence be unable to deliver the full 100 m3 of water when required for fire suppression) over the time frame of the simulation (i.e., the next 100 days).
What we want to know is the probability of the minimum value being zero (as this would imply that a withdrawal completely emptied the pond). From the chart, we can see that this appears to be around 5% (the y value at x=0).
We can see the exact value by looking at the Calculator section of the dialog. - In the Calculator section
of the dialog, enter a Value of 0:
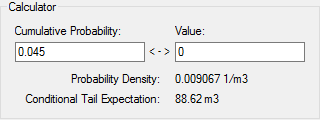
When you do so, GoldSim displays the Cumulative Probability of that result. That is, it indicates the probability of the volume being at (or less than, which in this case, is impossible) that value.Hence, there's our answer: the probability that the pond will actually be emptied (and hence be unable to deliver the full 100 m3 of water when required for fire suppression) over the time frame of the simulation is 4.5%. - Close the window by clicking on the X in the upper right hand corner of the window.
- Press F4 to return to Edit Mode The state of a GoldSim model when it is being edited and does not contain simulation results..
- Press the Save button in
the toolbar (or press Ctrl+S):

Note: Your result will not look identical to this (although it should be close). This is due to differences in the random number seeds.In fact, you will note that the result shown above (4.5%) is actually different from the result produced by the original model (4.3%), since the two models were created separately.As the number of realizations increases, the variation in results would decrease.