Computing the Minimum Volume Observed During a Simulation
Lesson 4, page 12 of 14
We have now almost completed our model. The primary output For an element with multiple outputs, the output that has the same name as the element (and is the output that is typically of greatest interest for the element). of the model is simply the volume of water in the pond as a function of time.This volume, however, is uncertain (and must be simulated probabilistically) due to the variability of the inflow rate, and the random nature of the fires (i.e., they occur approximately once every 50 days).
However, simply producing multiple time histories of the volume does not answer the question we are interested in.In particular, we want to know the likelihood that the pond will actually be emptied (and hence be unable to deliver the full 100 m3 of water when required) over the next 100 day period.
So how do we do that? What we need to do is to track the minimum volume of water observed over the course of the 100 day simulation.For a particular realization A single model run within a Monte Carlo simulation. It represents one possible path the system could follow through time., if this minimum is always greater than zero, it implies that the pond was always able to deliver water for fire suppression when needed. If the minimum is zero, it implies that for that realization, the pond was unable to deliver all the water that was required (since the only way it could be zero is if it was emptied by a fire event that was unable to withdrawal the full 100 m3).
So what we need to do is: 1) track the minimum volume observed for each realization; and 2) look at the statistics (i.e., the distribution) for of the minimum volume observed over all realizations.For example, if we run 1000 realizations, and find that in 200 realizations the minimum volume was zero, we can conclude that the likelihood that the pond will be emptied (and hence be unable to deliver the full 100 m3 of water when required) over the next 100 day period is 20%.
Keeping track of the minimum (or maximum) value of a variable over the course of a simulation in this way is often what you are interested in when carrying out any kind of simulation. Examples include:
- What is the highest predicted contaminant concentration in the river (or probabilistically, what is the probability that the concentration will exceed a specific regulatory value)?
- What is the highest predicted water level at the seawall (or probabilistically, what is the probability that the water will overtop the seawall)?
- What is the highest predicted cost for the project (or probabilistically, what is the probability that the project will exceed the budget)?
Because answering these kinds of questions is so commonly the objective of a simulation, GoldSim provides a specialized element to specifically do this, the Extrema element A Function element that records the highest (or lowest) value of a variable observed during a simulation.. Let's add one now.
Add an Extrema Element to Track the Minimum Observed Volume:
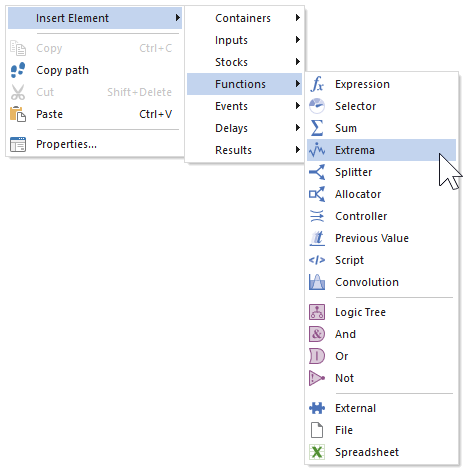
- In the Graphics pane The primary portion of the GoldSim interface, where the graphical depiction of the model is shown., right-click, choose Insert
Element, Functions, and then select Extrema:
Once you've inserted the element, its Properties dialog will immediately open: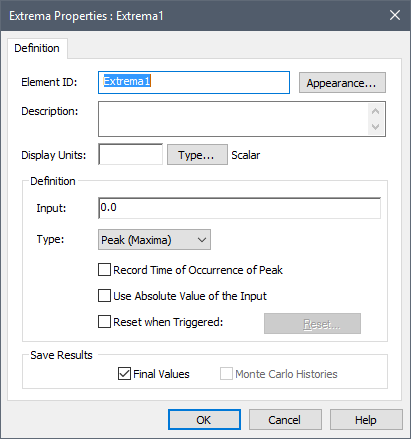
- In the Element ID field, type "Minimum_Volume".
- In the Description field, type "Lowest volume observed in pond".
- In the Display Units field, type "m3".
- The Input is simply the output that we want the Extrema element to operate on.So type in Pond.
- The Type field
determines whether the Extrema computes the "Peak (Maxima)" or "Valley
(Minima)".In this case, we want "Valley (Minima)". The Extrema
dialog should look like this:
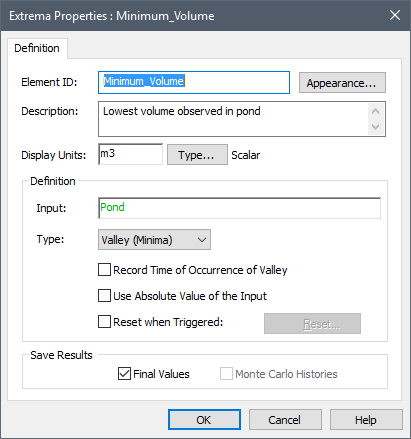
- Press OK to close the dialog.
- Press the Save button in
the toolbar (or press Ctrl+S):

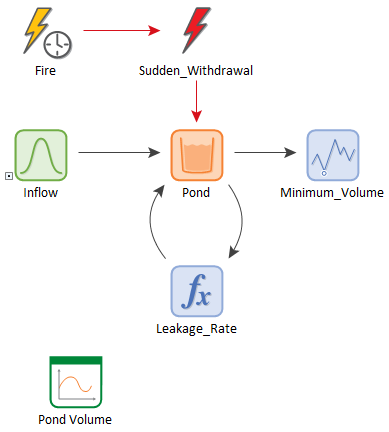
The graphics pane should now look similar to this: