Carrying Out Sensitivity Analyses on a Model
Lesson 5, page 13 of 15
GoldSim provides the ability to carry out a special type of run to facilitate sensitivity analyses.For this type of run, you specify the result you are interested in, and one or more variables that you want to analyze (which must be Stochastic An Input element that allows you to quantitatively represent the uncertainty in a model input by defining it as a probability distribution. or Data elements The basic building blocks with which a GoldSim model is constructed. Each element represents a feature, pararamer, process or event in the model.).
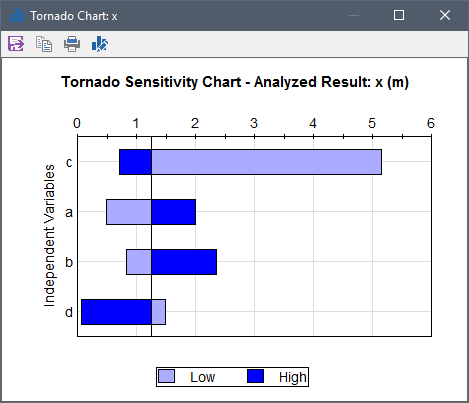
GoldSim then runs the model multiple times, systematically sampling each variable over a specified range, while holding all of the other variables constant.This then allows GoldSim to produce sensitivity plots (i.e., a tornado chart A type of sensitivity analysis that provides a graphical representation of the degree to which the Result is sensitive to the specified Independent Variables, so named because the chart consists of graphical bars that increase in sized toward the top and hence take on the appeareance of a tornado. and X-Y function charts) to assist you in graphically identifying the variables in your model to which the result is most sensitive:
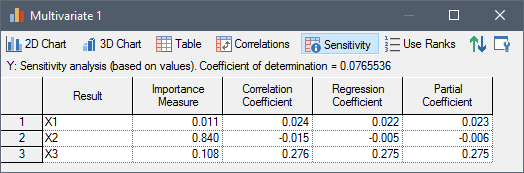
GoldSim also provides a second type of sensitivity analysis in which statistical sensitivity measures are computed by analyzing the results of multiple realizations of the model where all of the Stochastic variables are simultaneously sampled each realization A single model run within a Monte Carlo simulation. It represents one possible path the system could follow through time.: